sat-spotter-cli
A Python command-line tool for tracking satellites and predicting when they will pass overhead. Built with a focus on European and ESA satellites, defaulting to Warsaw time, and designed to answer the practical question: is tonight's pass worth stepping outside for?
- Python
- Skyfield
- Rich
- NumPy
- Matplotlib
01Commands
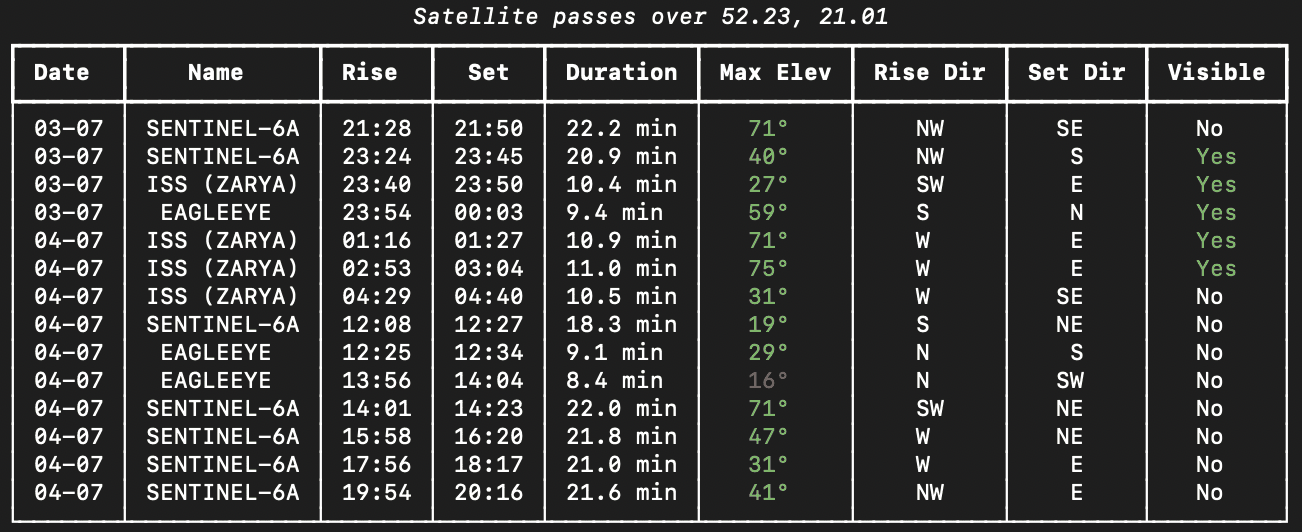
The main command is sat-spotter passes: it fetches the current TLE for each tracked satellite from CelesTrak, runs Skyfield's SGP4 propagation for the requested time window, and prints a table of passes with rise time, peak elevation, set time, compass directions at each event, and a naked-eye visibility flag.
Supporting commands round out a complete workflow: search looks up a satellite by name on CelesTrak and adds it to the tracked list; list shows what's currently tracked; remove lets you drop one; plot renders all predicted passes on a polar sky chart using Matplotlib (optional viz extra).
02Visibility and display
Elevation is color-coded in the terminal output via Rich: green for high passes (good viewing), yellow for moderate, red for low-horizon passes. A --visible-only flag filters to passes where the satellite is sunlit and the observer's sky is astronomically dark - the same two-condition test used by the satellite_observer Dart package.
Results can be exported to CSV or JSON for further analysis. TLEs are cached for four hours to avoid hammering CelesTrak on every invocation.
03Stack
Skyfield drives all astrodynamics - TLE propagation, position, and event timing. httpx handles TLE fetching. Rich produces the colored terminal tables. NumPy backs the numeric work. The optional viz extra adds Matplotlib for sky charts and Plotly for interactive variants. The project uses ruff for linting and pytest for tests, with Python 3.12 as the minimum runtime.
Next
sat-spotter-api