Wazuh SIEM
Author
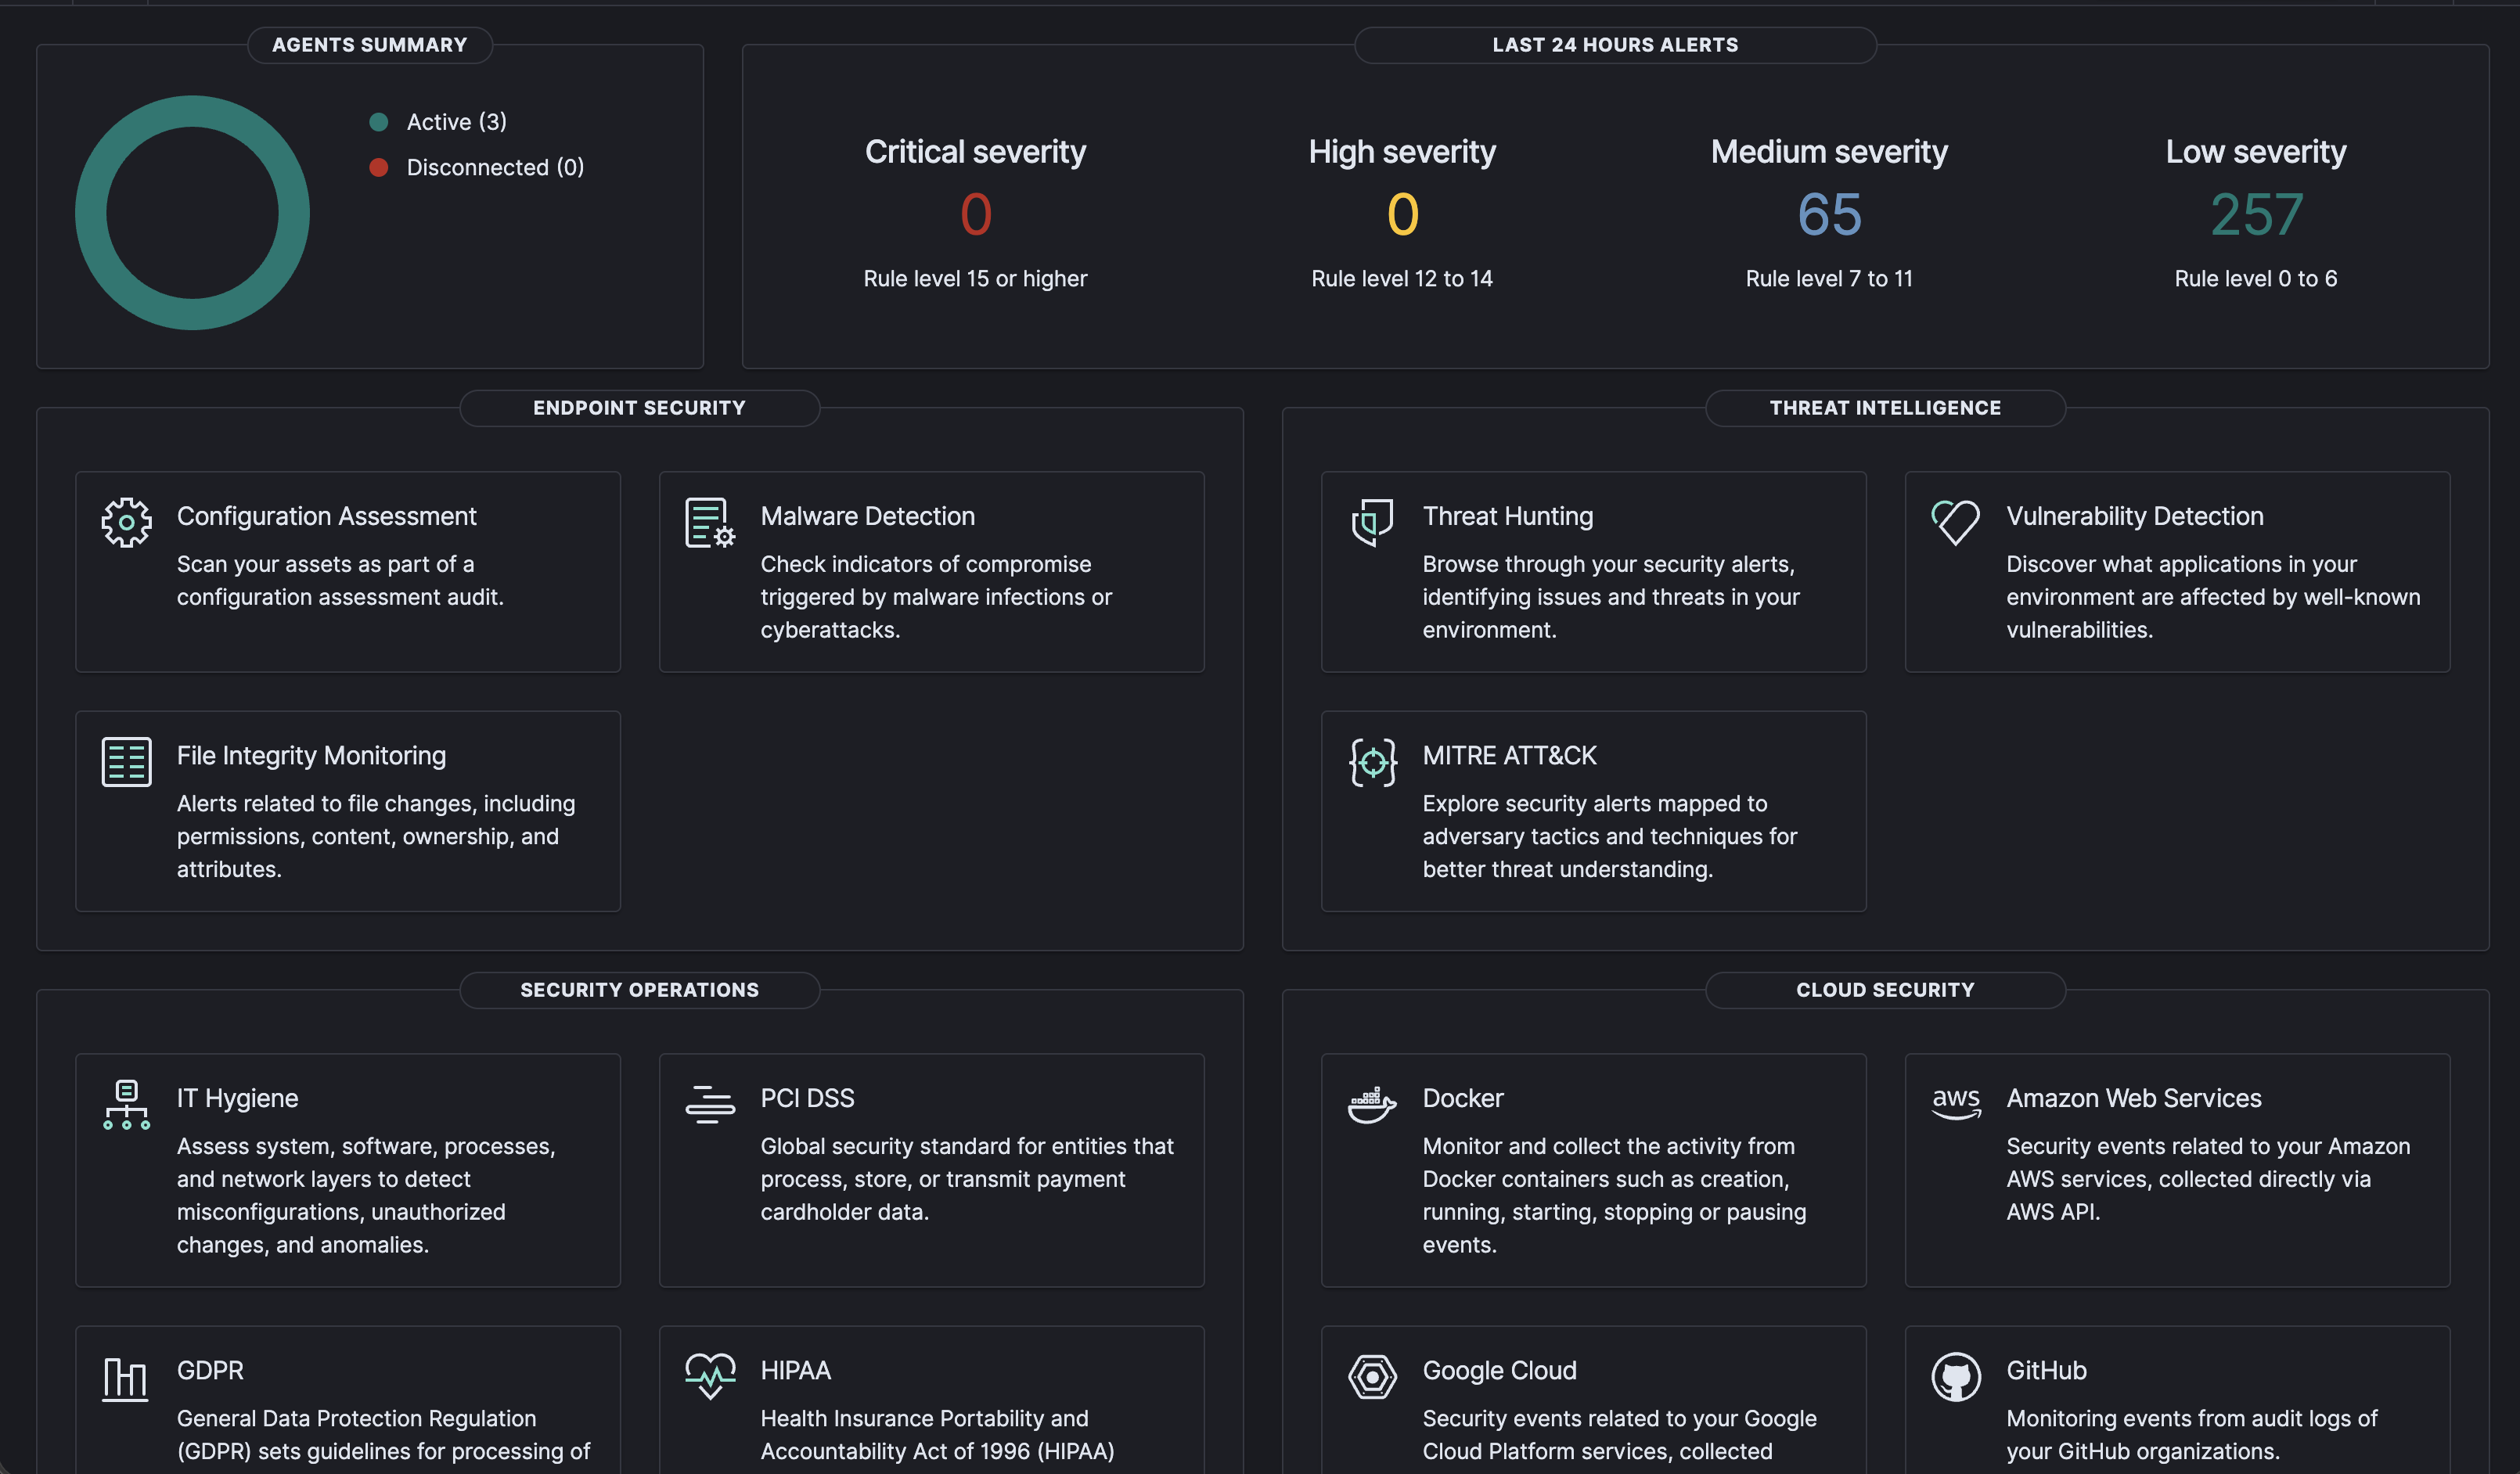
A self-hosted Wazuh SIEM as the security backbone - manager and dashboard at home, agents on every host, custom detection rules written from scratch on top of the defaults, and an AI triage pipeline that turns raw severity-7+ alerts into a one-line verdict before they reach my chat.
- Wazuh
- OSSEC rules
- Python
- Ollama
TOPOLOGY
The Wazuh manager and dashboard run in Docker on the home server, fronted by the reverse proxy. Agents on each host - home server and both cloud VPS - report to the manager over the Tailscale overlay network, never the public internet. The dashboard gets a valid public TLS certificate from Caddy even though the upstream uses a self-signed cert, via TLS skip-verify on the internal hop.
CUSTOM DETECTION RULES
The built-in ruleset is a starting point. The custom rules target authentication abuse with increasing precision: a single JWT failure is informational, but ten failures in five minutes from one IP fires a level-10 brute-force alert (rule 100120, mapped to MITRE T1110.004). The rule that follows watches for a success from an IP that already tripped the brute-force rule - the 'they got in' signal - at level 12.
Additional rules cover expired-token spikes (a sign of probing or a broken client), JWT requests with an invalid signature (never a legitimate user typo), and Supabase auth-audit events: signup floods, password-recovery floods, bulk deletes, and MFA changes.
APP-LEVEL AUDIT TRAIL
The production API writes an append-only JSONL audit trail for every auth event. The Wazuh agent tails that file as a JSON localfile source, so Wazuh automatically parses every JSON key into queryable fields with no regex extractors beyond a tiny prematch anchor. A separate cron poller reads Supabase's auth audit log table and appends normalized events to the same file - two event families from one log source.
The result: application-level auth events (JWT verification, session state) and platform-level auth events (Supabase) flow through the same detection pipeline as SSH and host logs. One place to look.
AI TRIAGE
High-severity alerts don't land raw in my chat. A small webhook receiver intercepts anything at severity 7 or above, passes it to a local LLM through Ollama, and posts the model's one-line verdict to a chat channel. The sanitised setup script ships in the public repo.
The practical effect: at 3 a.m., I get 'brute-force from a new ASN, no success yet, low priority' - not five pages of raw alert JSON. Signal, not noise.
KEY TAKEAWAYS
- Self-hosted Wazuh with agents on every host, reporting over the private overlay network
- Custom rules: brute-force chains, success-after-brute-force (T1110.004), token abuse, Supabase auth events
- App-level JSONL audit trail feeds the same detection pipeline as host and SSH logs
- AI triage via local LLM: severity 7+ alerts become a one-line verdict before reaching chat
- Zero alert data leaves the network - inference stays on the home GPU